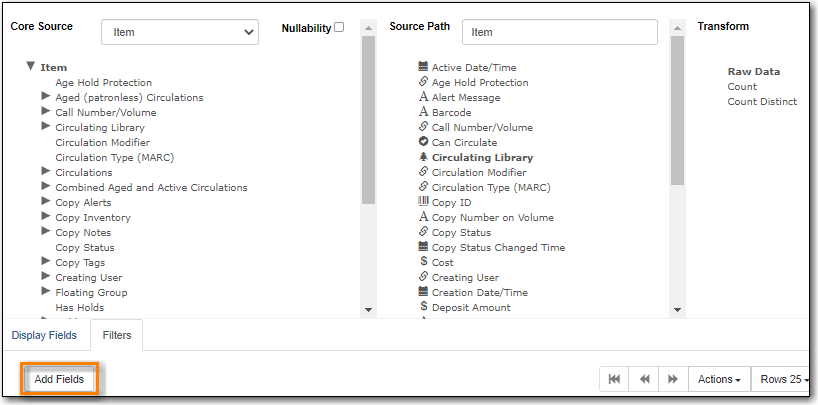
The Display Field and Filter Selector is where you build your display fields and filters for your template.
Every report template starts with a core source. This is the database table from which your template is built out. The top of the left-hand pane of the Display Field and Filter Selector section of the Report Template Editor contains the Core Sources drop down menu.
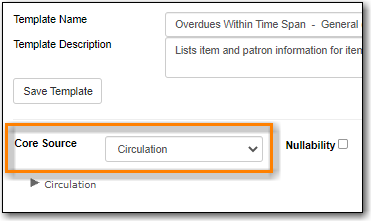
When modifying a template NEVER change the core source. This will scrap your existing template and you will have to start again from scratch.
When creating a new template the first thing you need to do is figure out which core source makes the most sense for the data you want to see in your report output. If you need information from other tables you’ll follow the links to those tables when adding display fields and filters.
The three most commonly used core sources are Circulation, Item, and ILS User. Templates for monthly circulation statistics and templates for tracking overdue items use the core source Circulation. Templates about the state of your collection use the course source Item. Templates containing counts or lists of your patrons use the core source ILS User. More information can be found in the section called “Commonly Used Tables”.
You can link to other database tables to include information contained in those tables but not every table links directly. For example, patrons and items aren’t directly linked to each other. Information about items out to a patron is held in the circulation table while information about items on hold is held in the hold request table. More information can be found in Chapter 38, The Evergreen Database.
The Nullability check box is beside the core source list. In general this check box should be left un-checked.
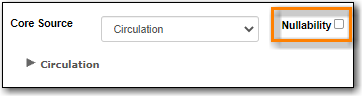
You may wish to use nullability if your report output includes null values that you don’t want included or if your report output doesn’t include null values that you do want to see. Nullability allows you to have more control over whether or not null values in fields are included in your report output. It does this by allowing you to manually select the way in which Evergreen is joining the database tables when running a report from the template. The type of join used will determine what kind of data can display a null value in your report output.
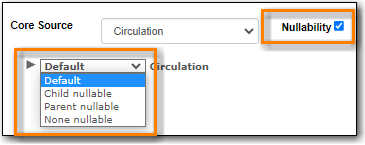
When Nullability is checked the following options show for joins between tables:
- Default - defined within Evergreen. See Chapter 38, The Evergreen Database for more information.
- Child Nullable = depends on the default join (usually left). Evergreen will include all records in the child table (linked to table).
- Parent Nullable = depends on the default join (usually right). Evergreen will include all records in the parent table (linked from table).
- None Nullable = equivalent to inner join. Evergreen will only include data that is in both tables
Note
You must use the same nullability selection on all display fields and filters that you add from the same table.
To learn more about nullability see the Evergreen conference presentation Thanks for Nothing: Nullability Selection in Evergreen Reports (45:00).
Display fields are the columns which will display in your report output.
- Ensure the Display Fields tab is the active tab in the Display Field and Filter Tabs section of the Report Template Editor.
Click on the top of the tree in the Core Source pane. A list of available fields will display in the Source Path pane.
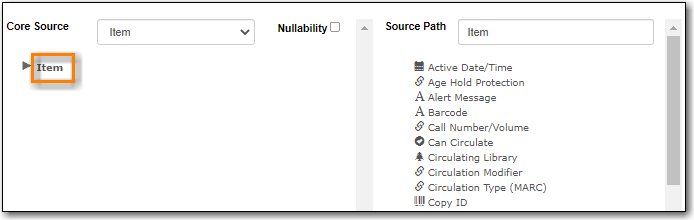
The icon beside the field name indicates the data type. If the field you want to use is a Link you need to expand the tree in the Core Source pane to find it and then click on it.
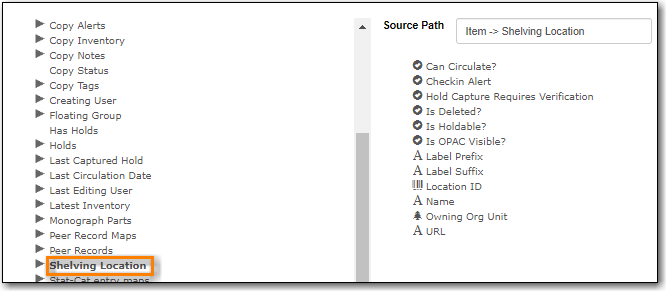
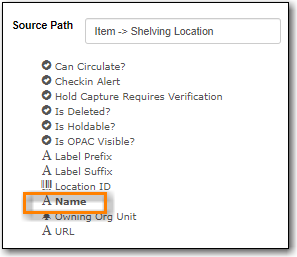
Click on the field in the Source Path pane you would like to add as a display field.
For display fields you generally want to pick a Text field over an ID or Org_unit field. For example, to add shelving location as a dislay field you will click on Name rather than Location ID.
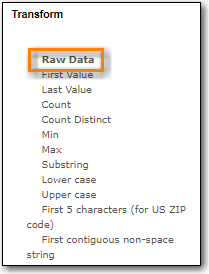
In the Transform pane click on the transform you would like to use. The transforms available in the list will vary depending on the data type of the selected field.
The transform will determine how Evergreen processes the data when generating the report. Raw data is the most commonly used transform for display fields except when it’s a timestamp in which case Date is more commonly used. More information on the available transforms can be found in the section called “Field Transforms”.
Your selected options will display in bold in the three panes. In the Display Fields tab click Add Fields.
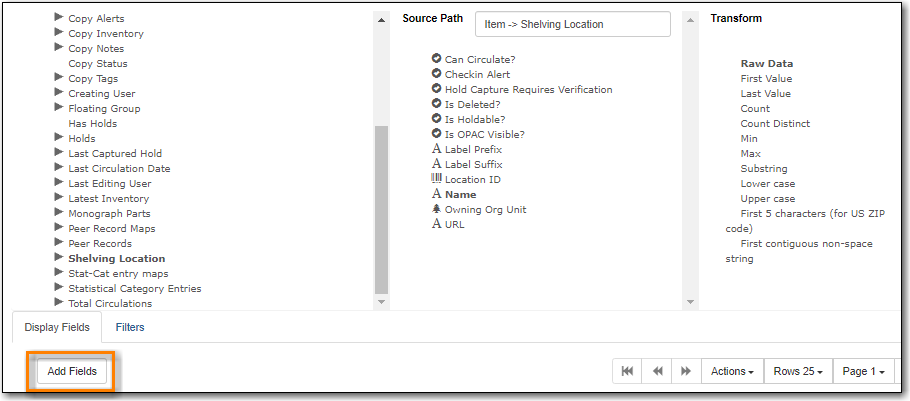
- Your display field will now display in the grid.
Filters allow you to set up the criteria so that Evergreen returns the information you are looking for. In most cases the value for the filter will be entered when the report is run, rather than included in the template.
- Ensure the Filter tab is the active tab in the Display Field and Filter Tabs section of the Report Template Editor.
Click on the top of the tree in the Core Source pane. A list of available fields will display in the Source Path pane.
The icon beside the field name indicates the data type. If the field you want to use is a Link you need to expand the tree in the Core Source pane to find it and then click on it.
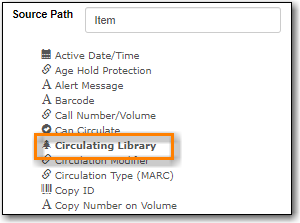
Click on the field in the Source Path pane you would like to add as a filter.
For filters you generally want to pick an ID or Org_unit field over a Text field. For example, to add circulating library as a filter you will click on Circulating Library which has the tree icon indicating it’s an Org_unit.
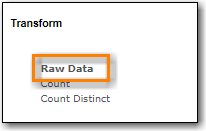
In the Transform pane click on the transform you would like to use. The transforms available in the list will vary depending on the data type of the selected field.
The transform will determine how Evergreen processes the data when generating the report. Raw data is the most commonly used transform for filters except when it’s a timestamp in which case Date or Month + Year is more commonly used. More information on the available transforms can be found in the section called “Field Transforms”.
Your selected options will display in bold in the three panes. In the Filter tab click Add Fields.
- Your filter will now display in the grid.
- If desired, you can hardcode the value of the filter into the template. See the section called “Updating a Filter Value”.
