Table of Contents
Once the folders are ready, you can create or clone a template. Templates allow you to run a report more than once, without building it anew every time by changing definitions (such as values for the filters) to suit current requirements. For example, a template counting patrons with a registration date within a time frame can be used to find out the number of patrons registered within the last month or the last ten days. Another example is a shared template that reports on circulation statistics at a given library. This can be used by other libraries by selecting their own library as the checkout/renewal library when they run the report.
Creating a template is complex. It requires some understanding of the Evergreen database and how Evergreen handles various records when performing tasks on the staff client. You may refer to the last section of this chapter for some background knowledge. Bear in mind that a template includes a list of displayed fields, the information you will see in the result, and a list of filter fields which enables you to set up the conditions for your target records. Generally you do not record your specific conditions in the template. For example, in an overdue template, you do not record 2018-01-01 as the due date. Instead, you just make the Due Date field in the circulation record as a filter field. When setting up the report with this template, you will be given the chance to put in 2018-01-01 as the due date.
It can be useful to plan out your report on paper before getting started with the reporting tool. The first thing to decide is the source table. You can choose only one starting source table for each template. If you need information from other tables, follow the link in the source table to those tables. Grouping together related fields and identifying the key fields will help you select the correct source.
We will take a report on circulation statistics as an example to show you how to create a template. In circulation statistic reports, libraries usually want to know how many items were checked out within a selected time period (in fact how many times items were checked out). When an item is checked out on the staff client, a record is created in the circulation table. You want a count of the number of circulation records created within the time period. So, the Circulation table is the source with which you want to start.
You may wish to break down the number of circulations by items' shelving locations to see the circulations by different types of materials (or the patrons' profile groups). In this case, the count of circulation records and the shelving location (or patron profile) are the potential displayed fields. For the filter fields, you need to limit the circulations done within a time period, so checkout date should be a filter. You want to count the circulations done at your library only as you are part of a consortium, or for all the branches of your library system. (In such a case, you may want to see the checkout library in the result, too.) So, the checkout/renewal library will be another filter.
With the above analysis, we will build the template from scratch in the following section to demonstrate the procedure on the template creating screen.
- Click on the My Folder template folder where you want the template to be saved.
Click on Create a new Template for this folder.

You can now see the template creating interface. The three columns below the template name and description are for database source table, fields in the selected table and available transforms for the selected field. You select fields for your template here. The lower portion is the selected displayed fields and fitlers in the template.
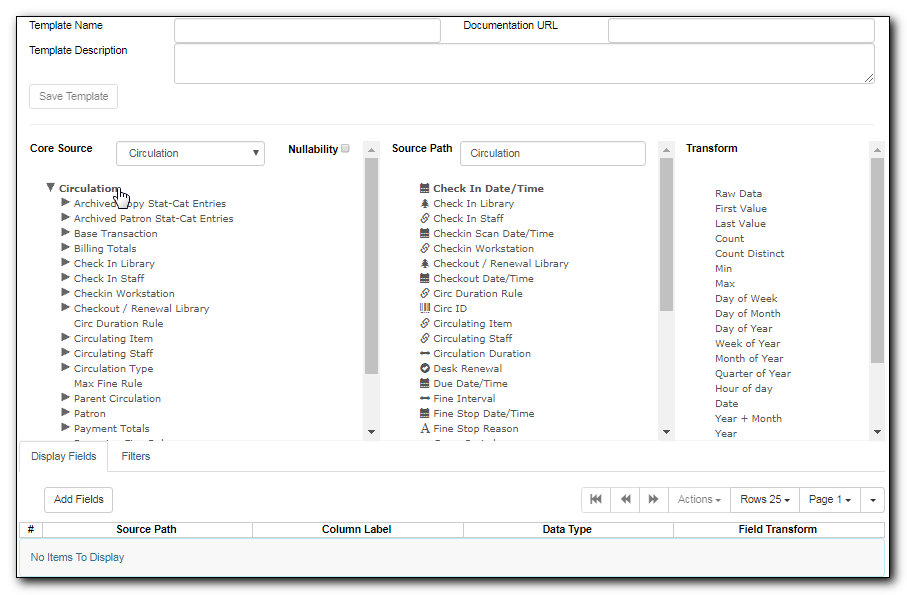
We will select the displayed fields for our template first. So make sure Displayed Fields is selected in the lower pane.
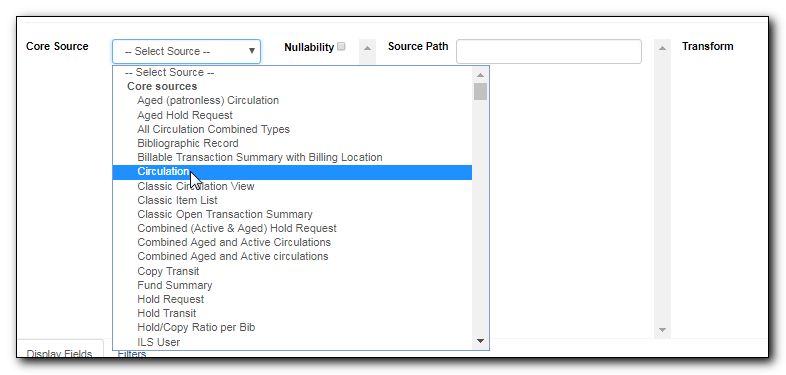
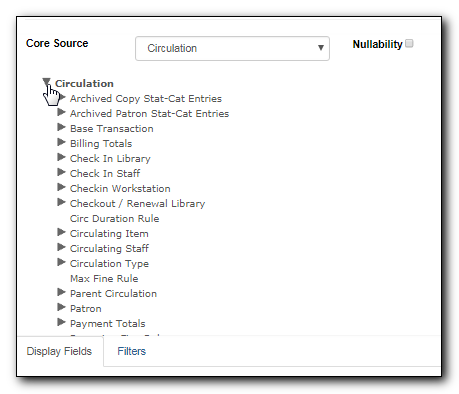
The top left hand pane contains the database Core Sources drop-down list. This is the list of tables available as a starting point for your template. Commonly used sources are Circulation (contains circulation records that may be used for circulation statistics and overdue reports), ILS User (contains patron records that may be used for patron reports), and Item (contains copy records that may be used for reports on collection or items with special status).
The Nullability check box beside the sources list is for specifying the join type between linked source tables. In most cases, it should be left unchecked by default, which is inner join. However, if you need to include records without a corresponding record in the linked table, you need to use the Nullability check box to specifiy left or right join. For details refer to the tip Nullability for how to use Nullability check box.
Select Circulation in the Sources drop down menu. Note that the Core Sources for reporting are listed first, however it is possible to access all available sources at the bottom of this drop down menu.
Caution
One template can have only one starting source table. If you need information from other tables you should follow the links made by the Reports interface to those tables. The reporting program can not put two pieces of isolated information together into one record in the result. When you change a starting table all your existing selected fields will be removed.
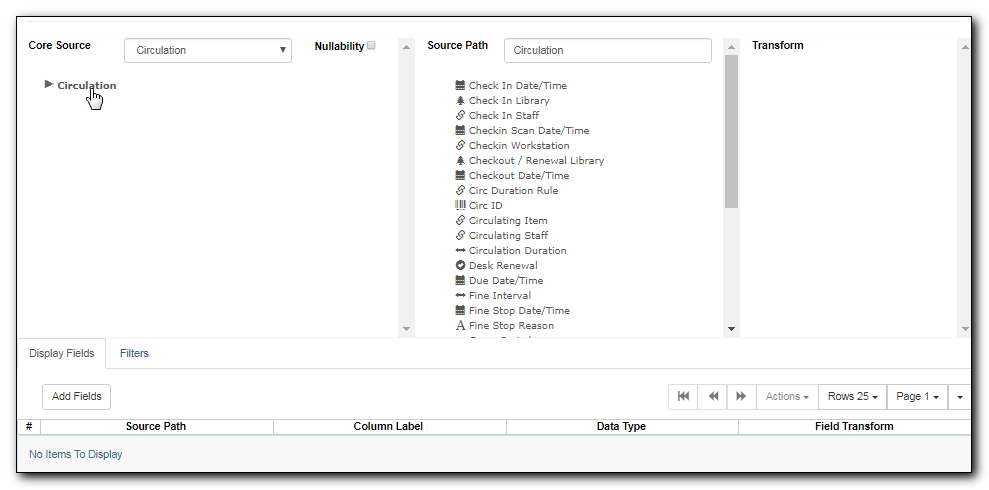
Click on Circulation to retrieve all the fields, which will be displayed in the middle column. The icon in front of each entry(field) indicates the data type of the value in the field. Refer to Chapter 34, Template Terminology: Data Types, Transforms, and Operators for details.
When you select a field in the middle column, the available data transforms of the selected field are displayed in the right column. Transforms specify how data should be processed before they are displayed/compared. Fields may contain different types of data, indicated by the little icon in front of each field. Different data types may be transformed differently. Refer to Chapter 34, Template Terminology: Data Types, Transforms, and Operators for details of transforms for each data type.
For our example template, select Circ ID in the middle column, and Count Distinct from the right Transform column. We are counting the number of circulation records.
Click Add Fields to add this field to your report output. Note that Circ ID now shows up at the bottom under Displayed Fields tab.
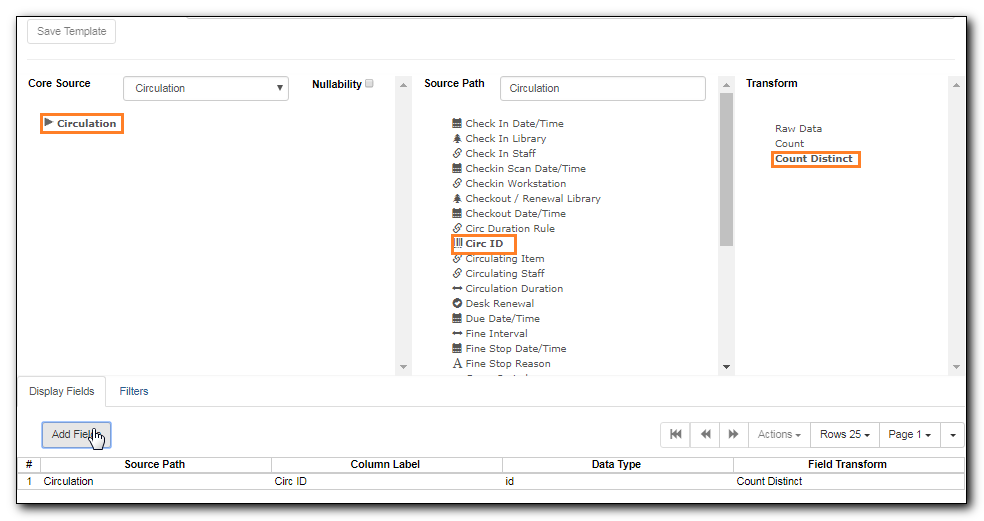
Circ ID will be the column header in the report output. You can rename default display names to something more meaningful. To do so in this example, select the Circ ID row and click Actions → Change Column Label. Type in a new name, "Circ Count", then click OK/Continue on the prompt.

Add other data to your report by going back to the Source area and selecting the desired fields. In this example, we are going to add Circulating Item’s Shelving Location to further refine the circulation report.
Shelving Location is listed in the Circulation table. But the icon in front of it indicates it is a , which means it is a record ID from another table. It is meaningless to most users. We need to display shelving location’s name. We will follow the link to Shelving Location table to select Name field. Click the arrow in fron of Circulation in the left table column to display the linked tables.
- Click on Shelving Location in the table list.
- In the middle Field column, select Name.
In the right Transform column, select Raw Data and click Add Fields. Use Raw Data when you do not wish to transform field data in any manner.
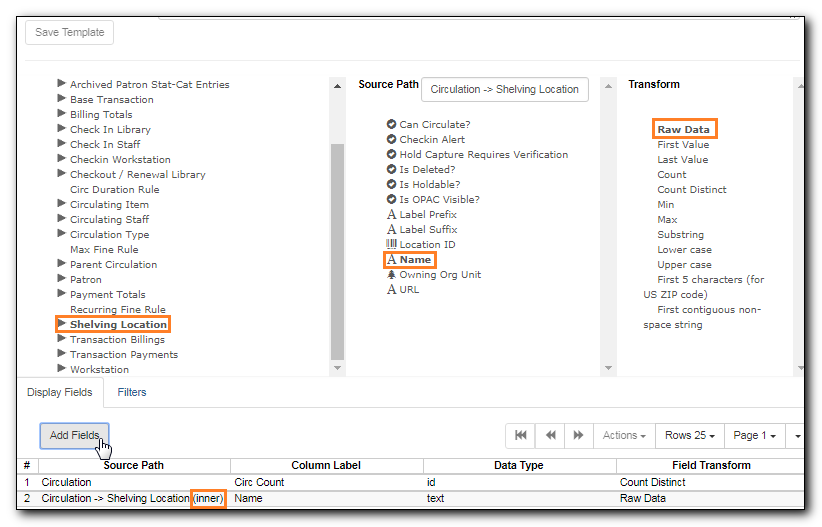
Name will appear in the bottom Displayed Fields tab. Select the Name row and click Actions → Change Column Label to the field name to Shelving Location.
Note
In the left Source Path column, (inner) indicates the join type between Circulation and Shelving Location table is inner join.
- Note that the order of rows (top to bottom) will correspond to the order of columns (left to right) on the final report. The results will be sorted by the columns in this order, too. Select Shelving location and click on Actions → Move Field Up to move Shelving location before Circ Count. The result will be sorted by Shelving Location first.
- Return to the Sources area to add more fields to your template. Under Sources click Circulation, then select Check Out Date/Time from the middle Field column.
- Select Year + Month in the right hand Field Transform column and click Add Fields
- Check Out Date/Time will appear in the Displayed Fields tab. In the report it will appear as a year and month (YYYY-MM) corresponding to the selected transform.
- Select the Check Out Date/Time row. Click Actions → Change Column Label to change the column header to Checkout month.
Move Checkout month to the top of the list using Actions → Move Field Up, so that it will be the first column in an MS Excel spreadsheet. Now, the report output will sort by the checkout month first, then by shelving locations.

Tip
Note that field transform can be changed after fields being added. Use the function on the Actions list.
